Lab 2 - IMU
Posted on 2026-02-10
1. Setup the IMU
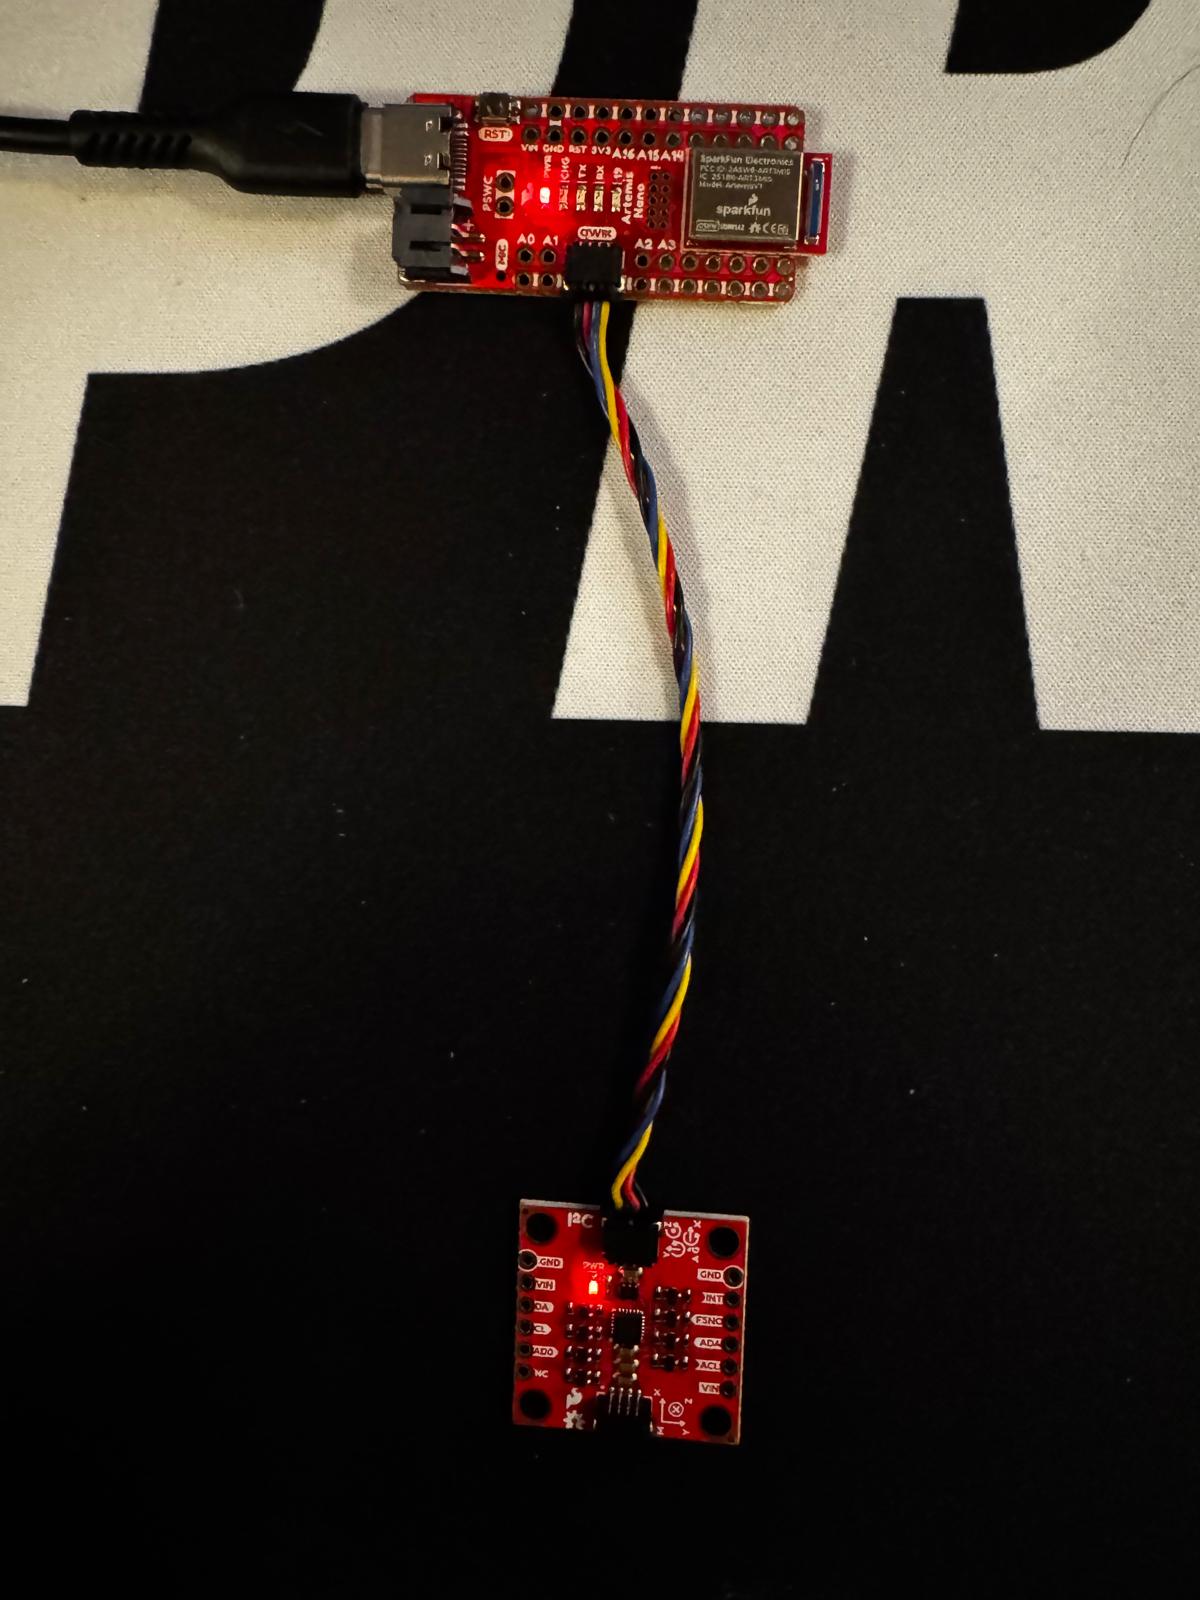
IMU connection:
Serial Monitor showing Example1_Basics output:
Open video if it doesn’t play above.
I setup the blink statements to confirm the board is running.
Arduino (LED blink in setup()):
pinMode(LED_BUILTIN, OUTPUT);
for (int i = 0; i < 3; i++) {
    digitalWrite(LED_BUILTIN, HIGH);
    delay(500);
    digitalWrite(LED_BUILTIN, LOW);
    delay(500);
}
Open video if it doesn’t play above.
AD0_VAL discussed:
AD0_VAL represents the last bit of the IMU’s ADC value. my board defaults to 1 in the arduino IDE.
2. Accelerometer
Setup for the pitch and roll from the accelerometer using atan2 of the appropriate axes. Serial plotter at −90°, 0°, and +90° for pitch and roll (five orientations).
Equations:
pitch = arctan2(a_x, a_z) × 180/π
roll  = arctan2(a_y, a_z) × 180/π
Arduino:
float pitch_a = atan2(sensor->accX(), sensor->accZ()) * 180.0 / M_PI;
float roll_a  = atan2(sensor->accY(), sensor->accZ()) * 180.0 / M_PI;
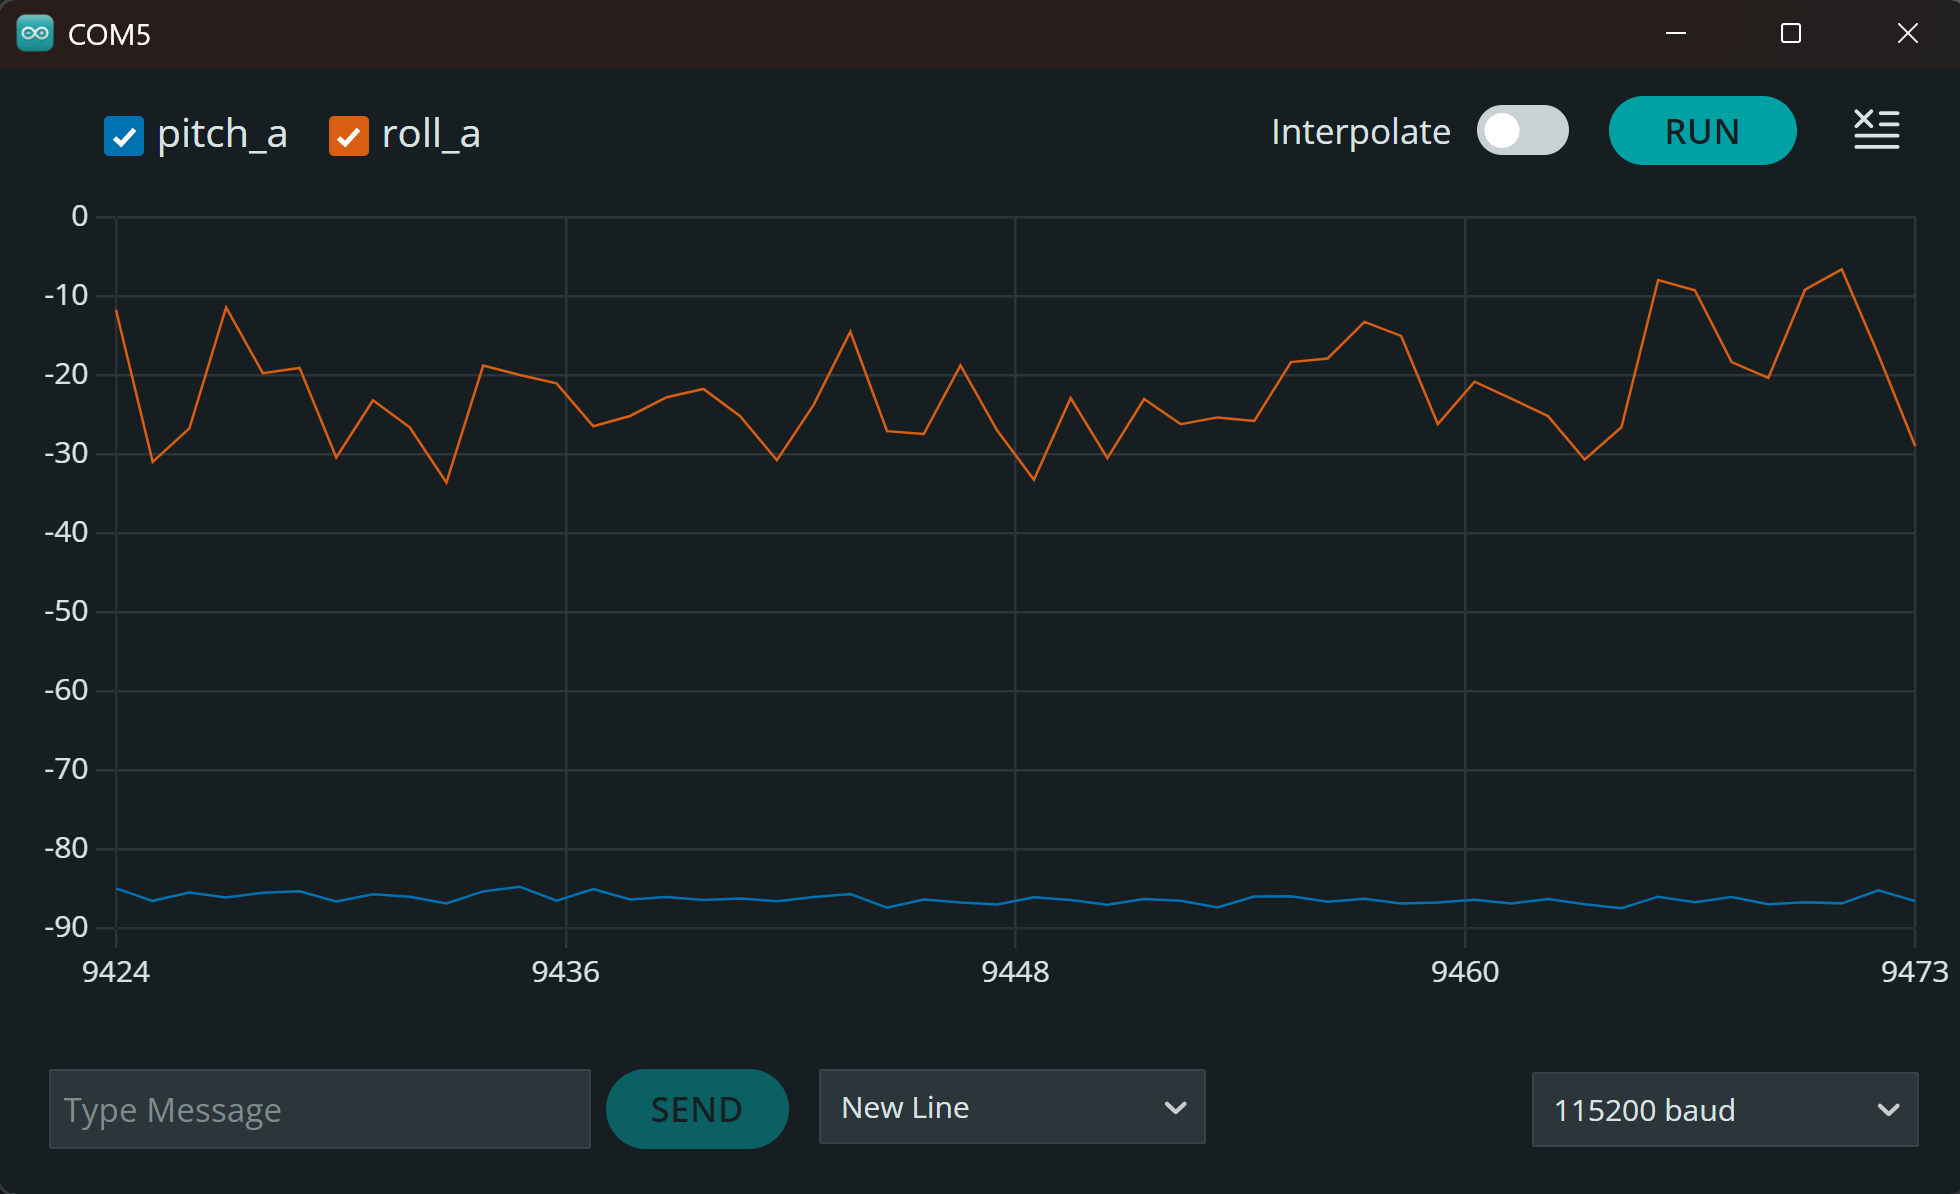
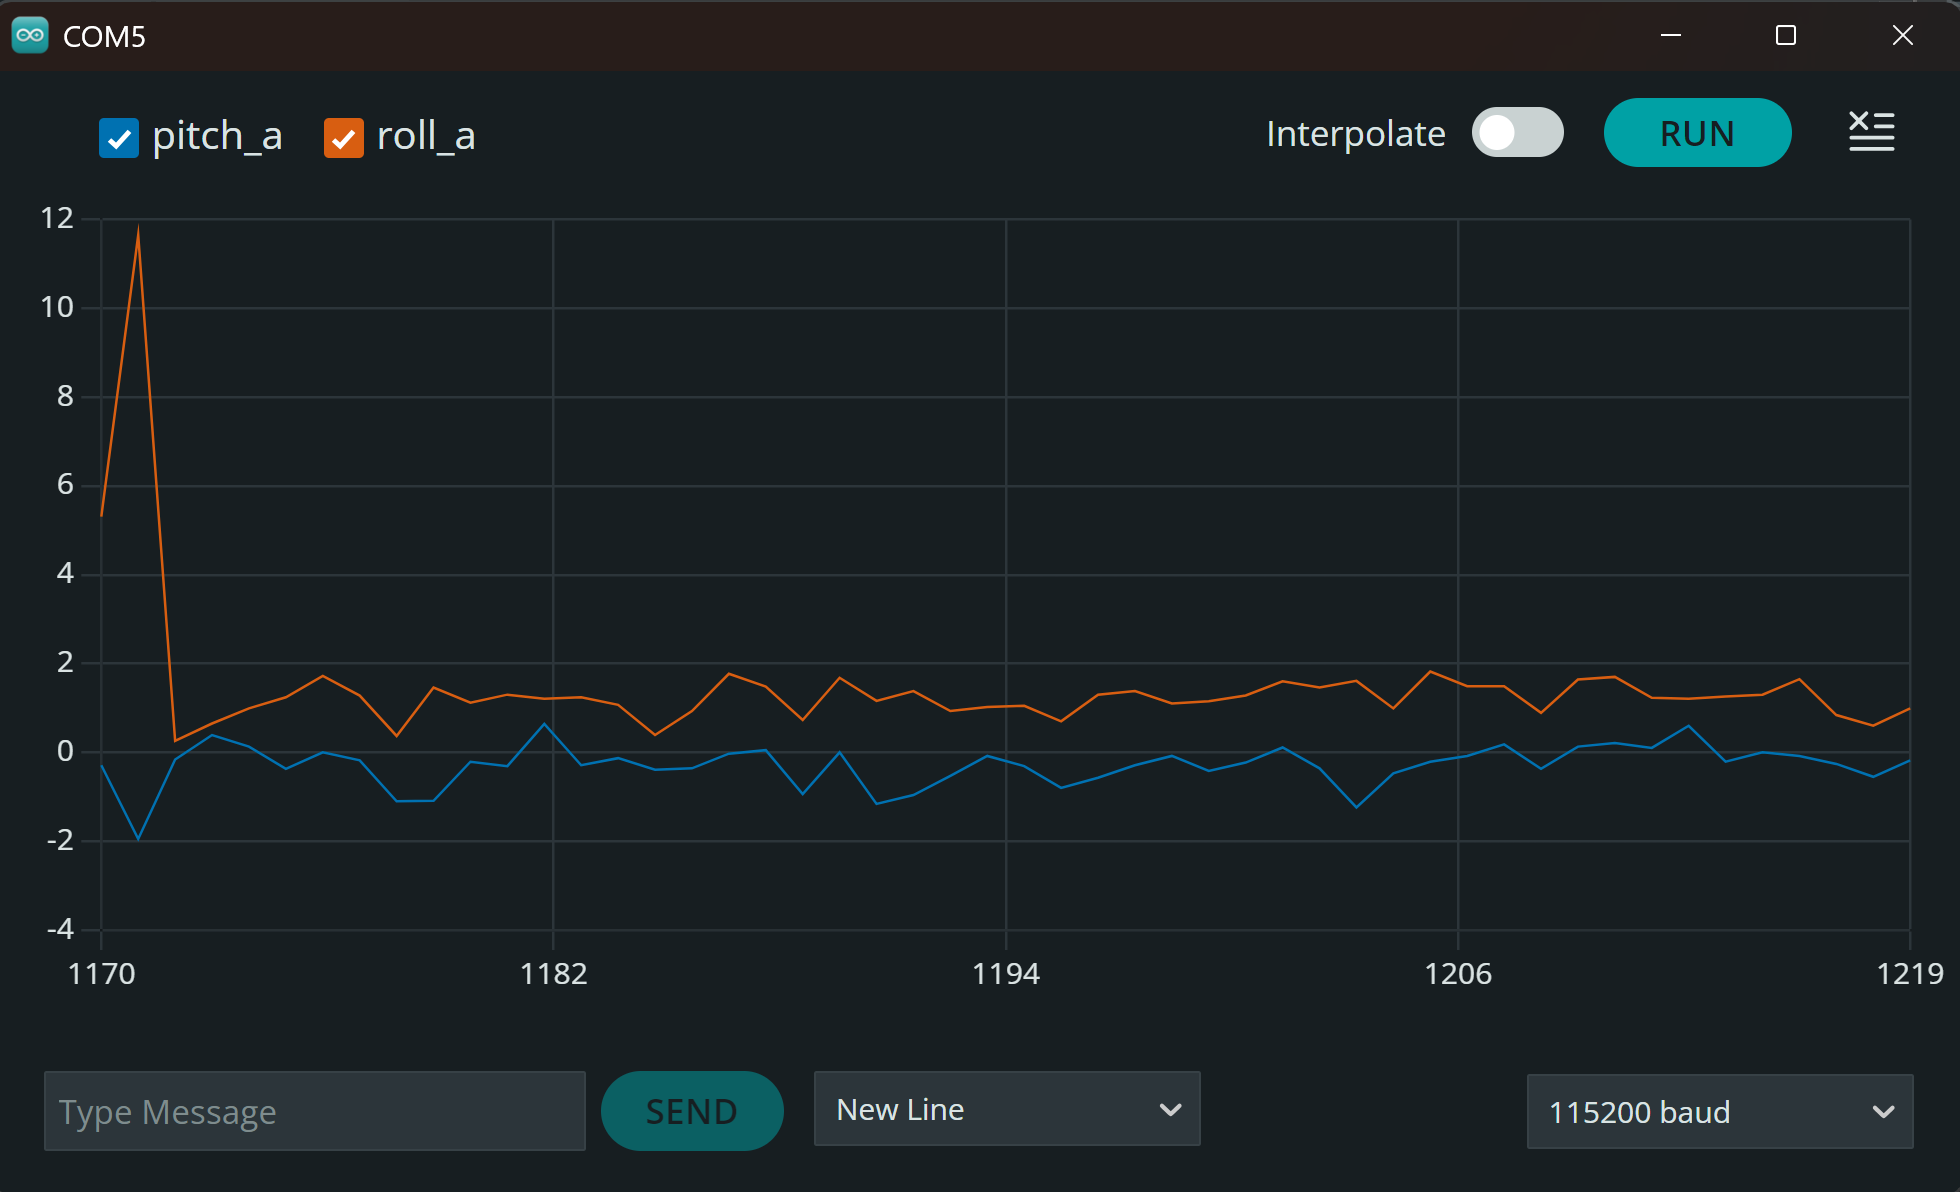
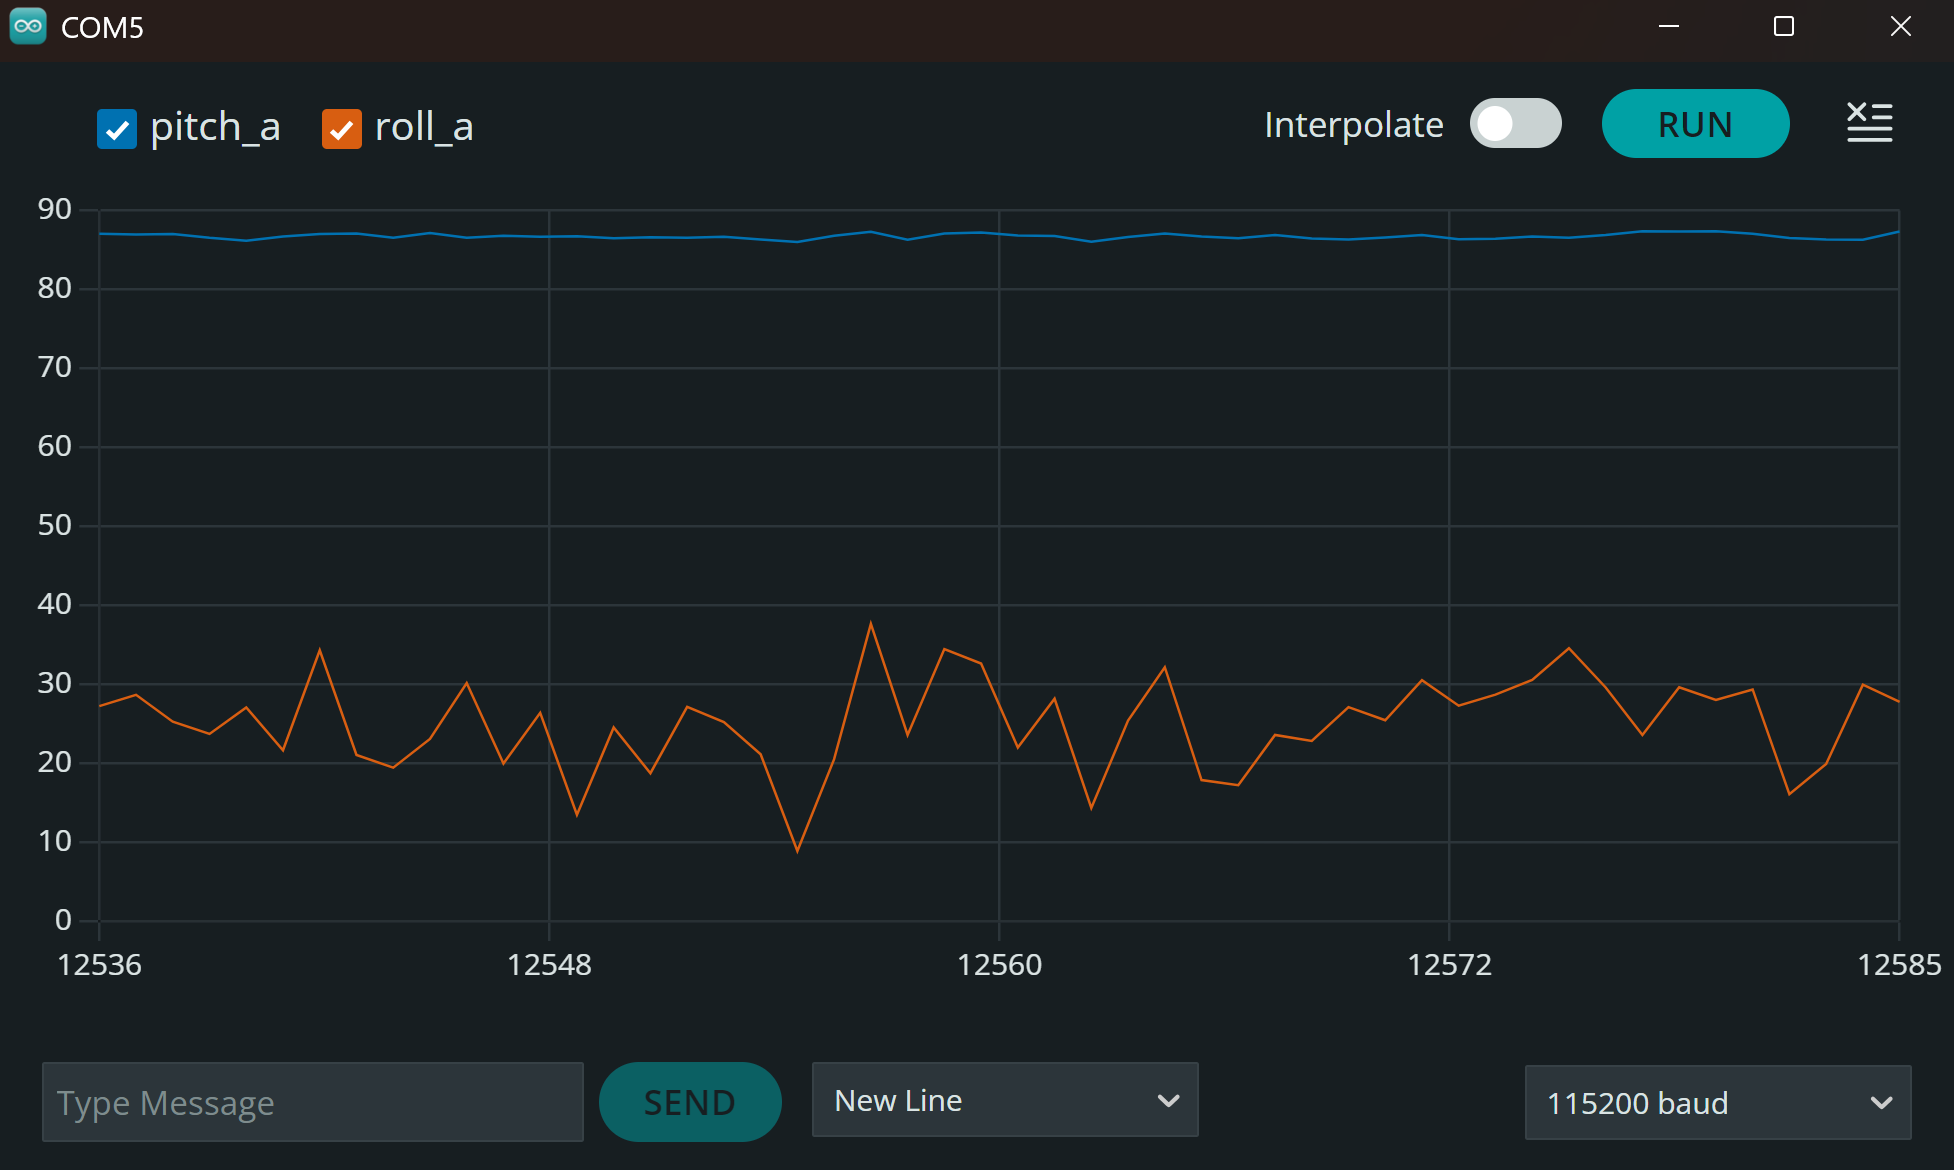
Serial plotter at pitch and roll orientations (−90°, 0°, +90°):
Pitch -90°, Roll 0°
Pitch 0°, Roll 0°
Pitch +90°, Roll 0°
Pitch 0°, Roll -90°
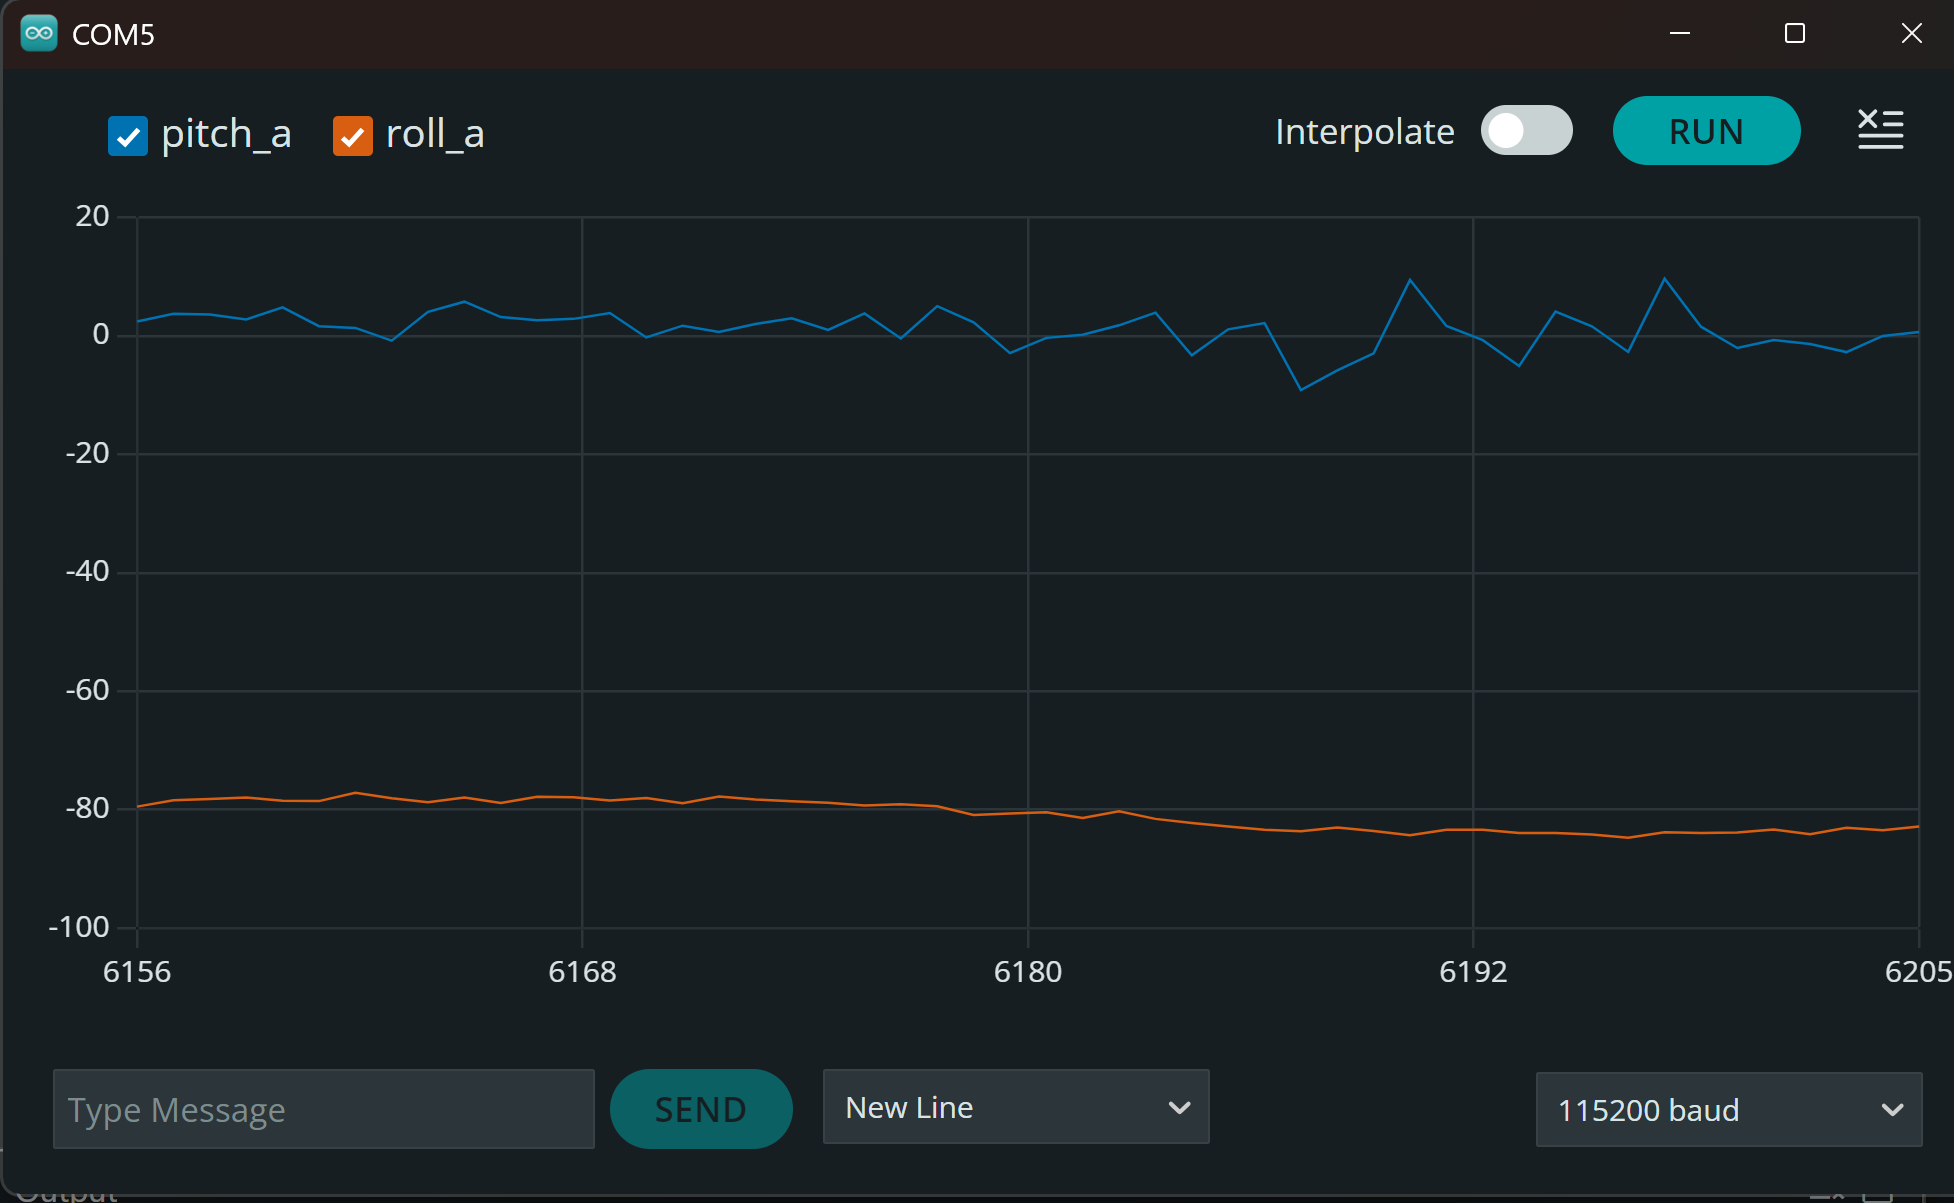
Pitch 0°, Roll +90°
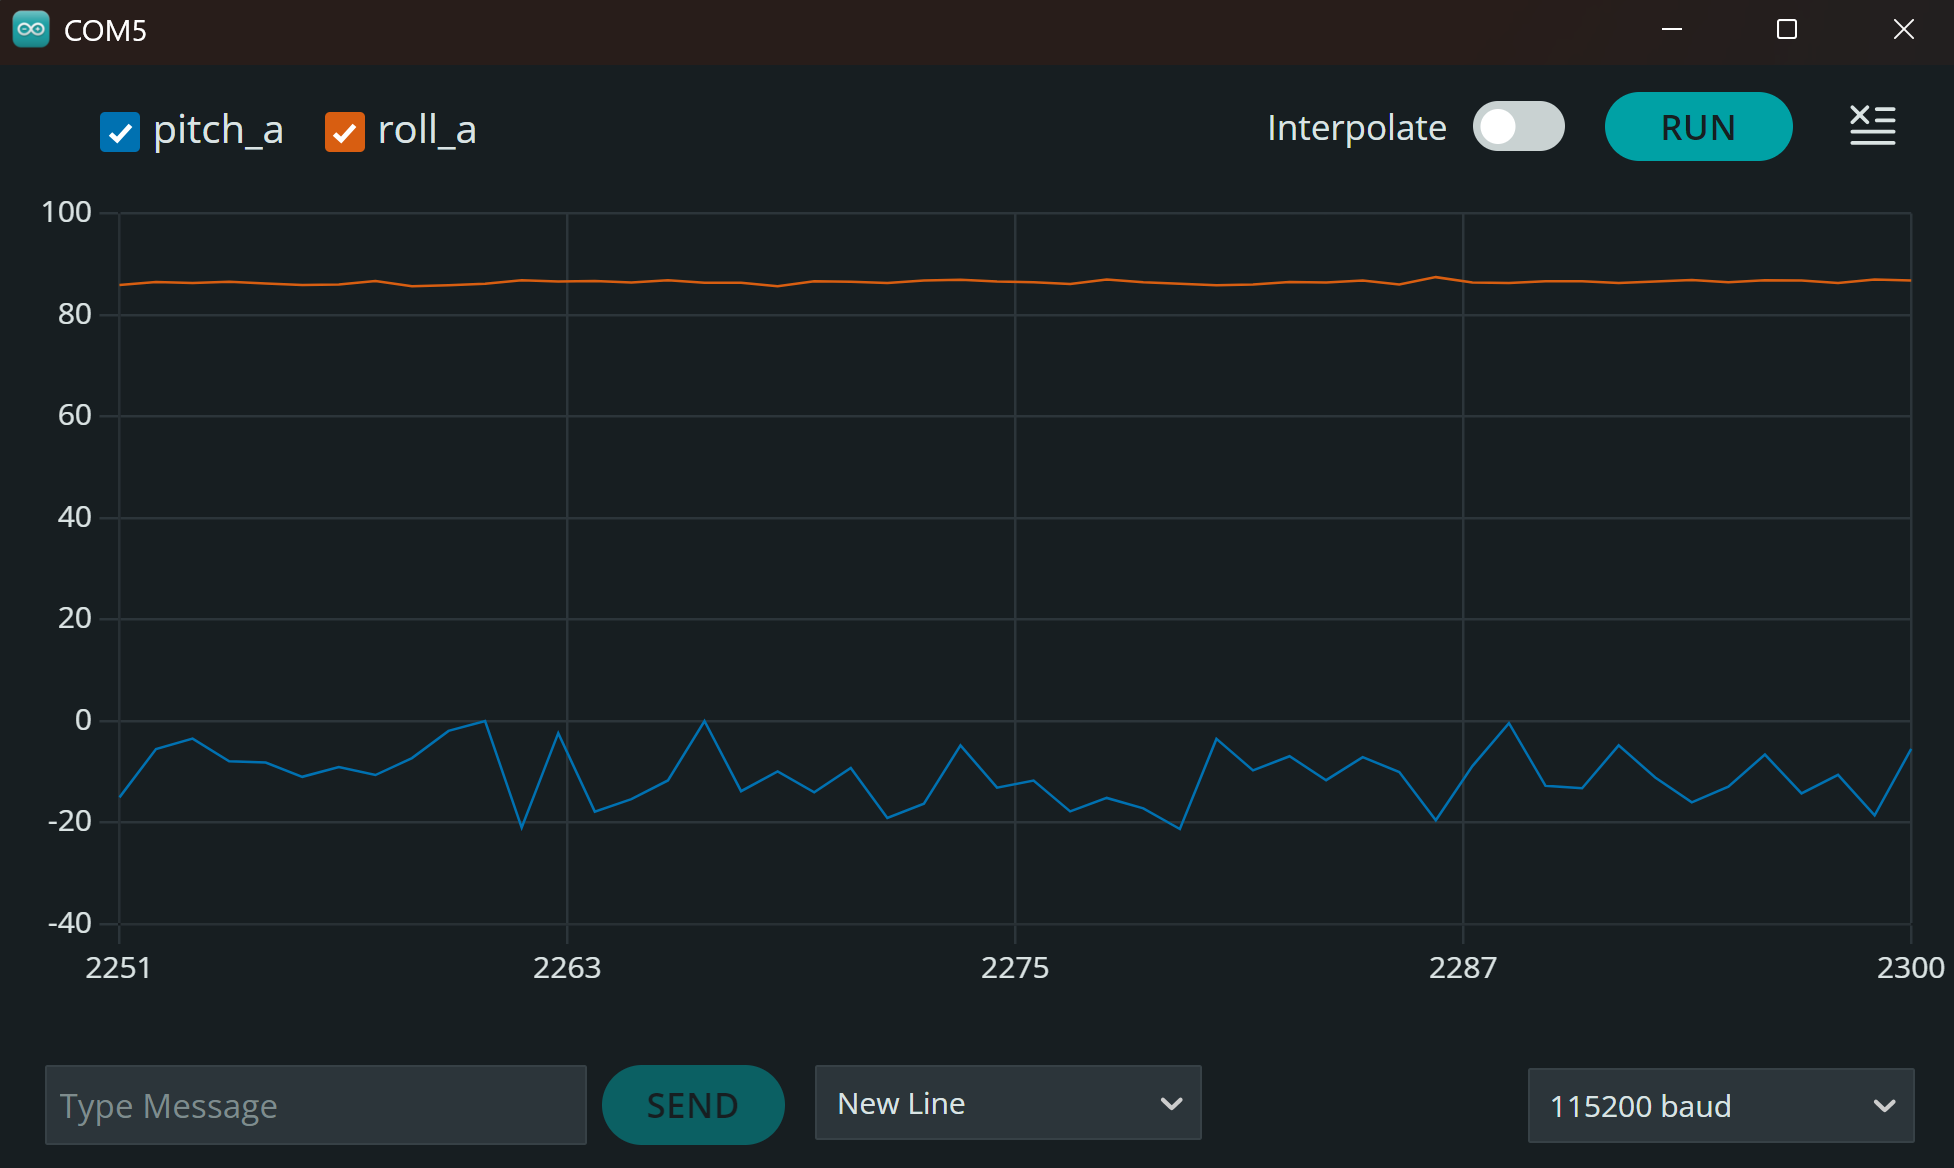
The accelerometer was reasonably accrate. I observe the values within ~1-2 degrees of the expected values. There were also small ofsets for pitch (~0.7) and roll (~1.8) when flat. This could be due to the slanted table I was recording on.
3. Noise and Fourier Transform
Raw time-domain accelerometer pitch/roll and FFT of pitch and roll. I used table taps as the lab suggested to record vibration on the table.
Raw accelerometer pitch and roll (time-domain):
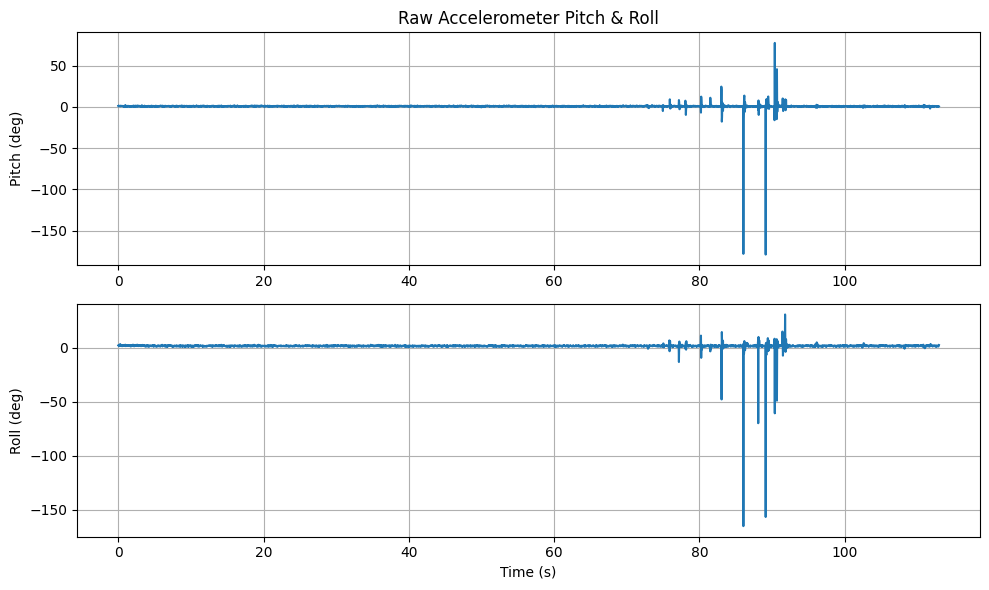
I recorded the accelerometer data at ~30 Hz sampling rate. With the board sitting flat on the table, the pitch and roll showed small fluctuations (same as before ~ 1 - 2 degrees). As seen in the images, the large spikes come from the taps of the table.
FFT of pitch and roll:
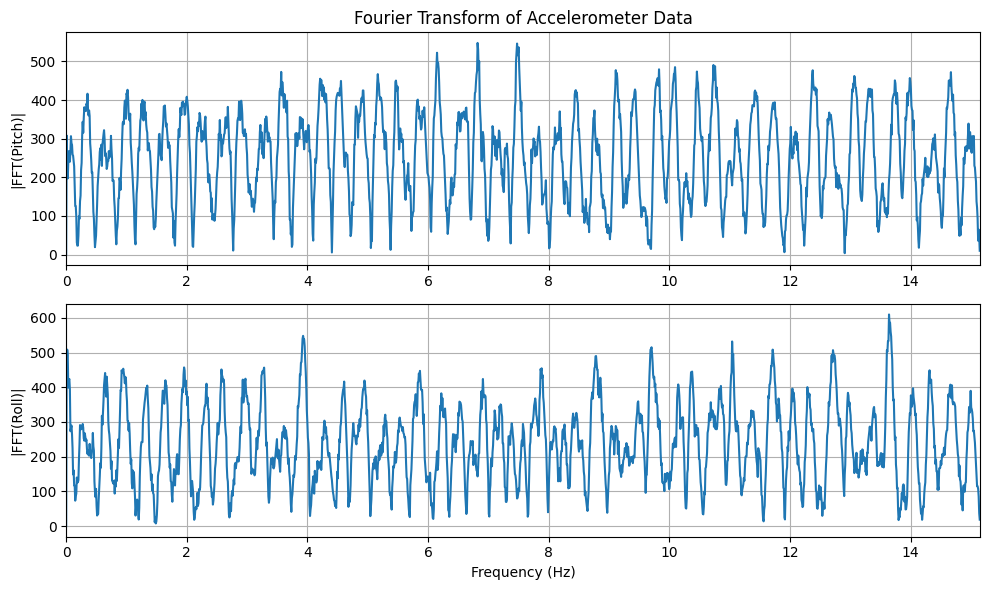
The FFT showed the energy spread across the entire frequency and gave me the characteristics of impulsive/broadband noise from te vibrations.
from the plots we can see that a cutoff frequency of ~4-5 Hz is appropriate since most of the changes occure below 5Hz, and anythign above is the vibration noise.
4. Low-Pass Filter
Low-pass filter to smooth the accelerometer signal; raw vs filtered overlay.
Equation:
y[n] = α·x[n] + (1 − α)·y[n−1]
Arduino:
const float alpha = 0.2;
pitch_LPF = alpha * pitch_a + (1 - alpha) * pitch_LPF;
roll_LPF  = alpha * roll_a  + (1 - alpha) * roll_LPF;
Raw vs filtered:
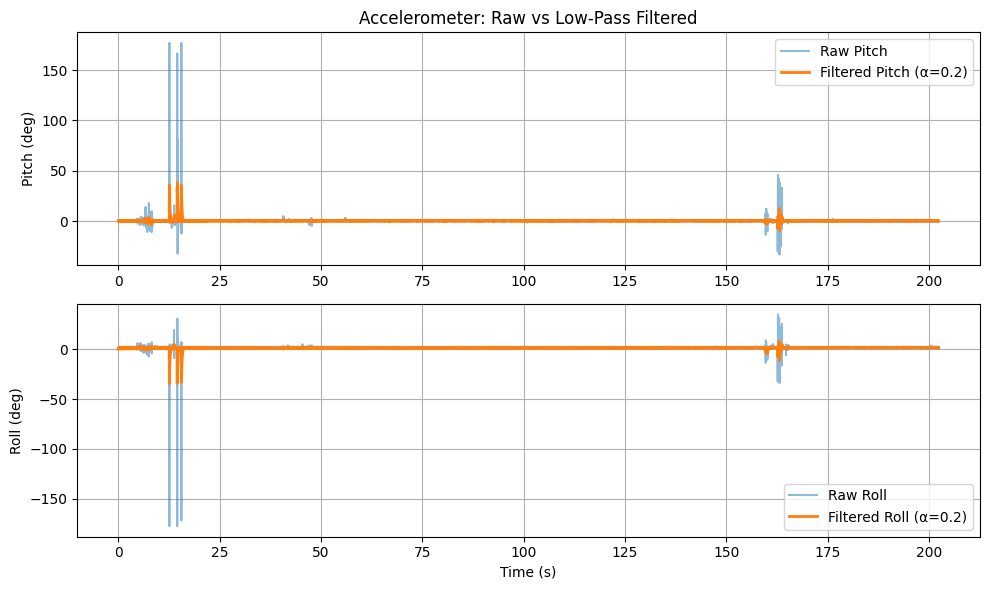
The low-pass filter smoothed the accelerometer signal and reduced the high-frequency noise. The filtered plot shows a more stable pitch and roll values, with less spike amplitude.
5. Gyroscope
Integration of gyro rates for pitch, roll, and yaw. Three-panel comparison: pitch, roll, yaw (accel vs gyro).
Equations:
pitch_g = pitch_g + ω̇_x · dt
roll_g  = roll_g  + ω̇_y · dt
yaw_g   = yaw_g   + ω̇_z · dt
I computed the gyro angles by integrating angular velocity over time.
Arduino:
float dt = (now - last_time) / 1000.0;
pitch_g += sensor->gyrX() * dt;
roll_g  += sensor->gyrY() * dt;
yaw_g   += sensor->gyrZ() * dt;
Accelerometer vs gyroscope (pitch, roll, yaw):
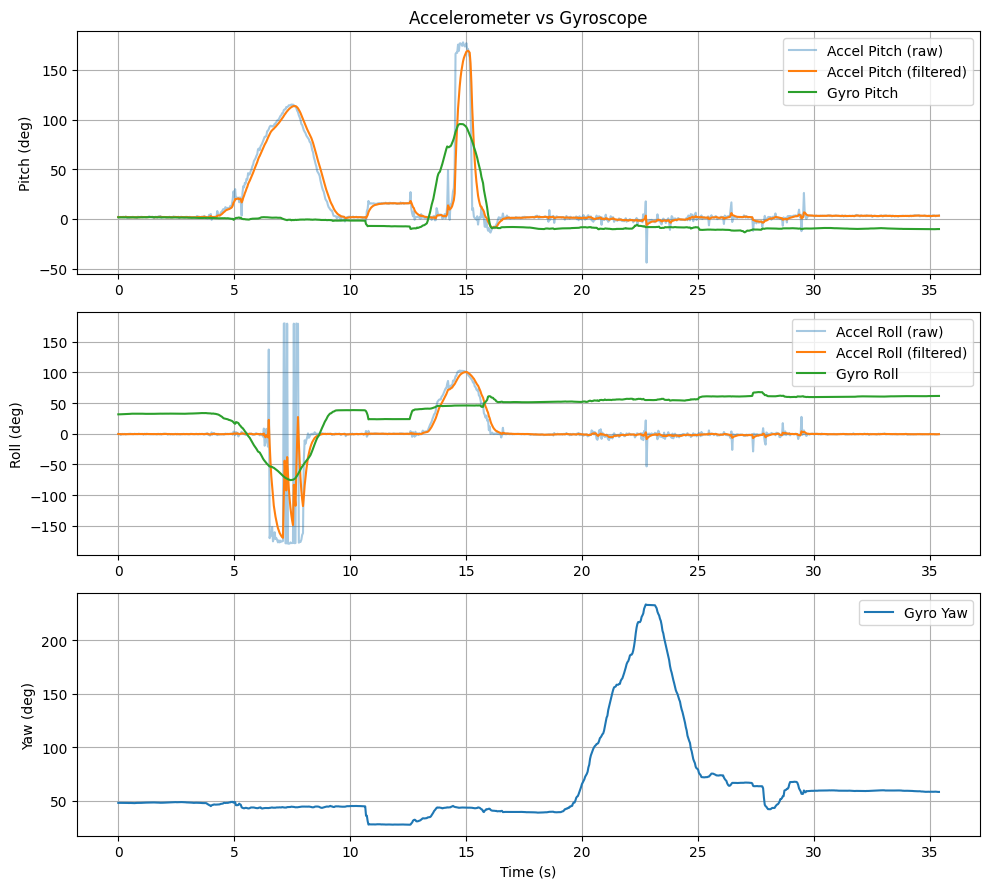
I noticed a few key differences between the gyroscope and the accelerometer: the gyroscope provides smooth angle tracking and can measure yaw (the accelerometer cannot). However, i noticed that the gyroscope drifts over time the sequence of rtations made it dificult returning to the same angle. Additionally, the accelerometer is noisy but alwasy retursn correct values since it measures gravity directly.
6. Complementary Filter
Fusing accelerometer and gyroscope with a complementary filter; overlay of accel, gyro, and complementary output.
Equation:
θ = (1 − α)(θ + ω̇·dt) + α·θ_accel
Arduino:
const float alpha_comp = 0.02;
pitch_comp = (1 - alpha_comp) * (pitch_comp + gyrX * dt) + alpha_comp * pitch_a;
roll_comp  = (1 - alpha_comp) * (roll_comp  + gyrY * dt) + alpha_comp * roll_a;
Complementary filter (accel vs gyro vs complementary):
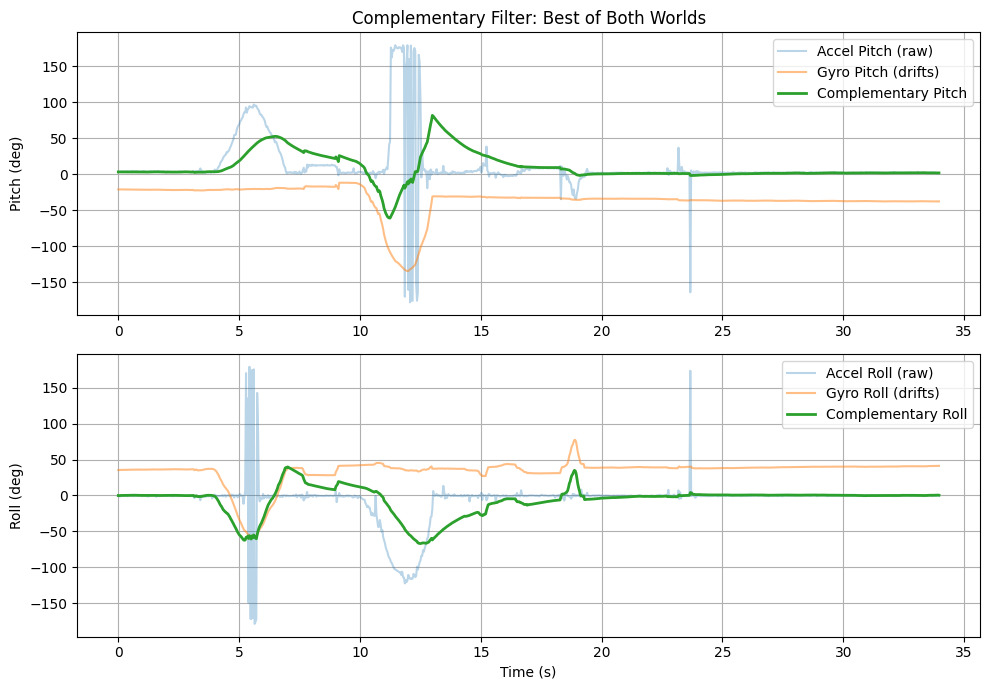
The complementary filter combines the best of both sensors: the gyroscope is smooth with no vibration spikes, while the accelerometer takes out the dirft and helps angle return to 0 when the board is flat.
7. Sample Data
IMU data was collected at high rate and sent over BLE (~5 s of data). Fast collection in the loop and notification handler in Python.
Arduino (fast data collection in loop()):
if (imu_collecting && imu_index < IMU_ARRAY_SIZE) {
    if (myICM.dataReady()) {
        myICM.getAGMT();
        // store in arrays, no Serial.print, no delay
        imu_index++;
    }
}
Python (notification handler):
def imu_notification_handler(uuid, data):
    s = ble.bytearray_to_string(data)
    parts = s.split("|")
    if len(parts) == 6:
        imu_data.append([float(p) for p in parts])
5 s of IMU data over BLE:
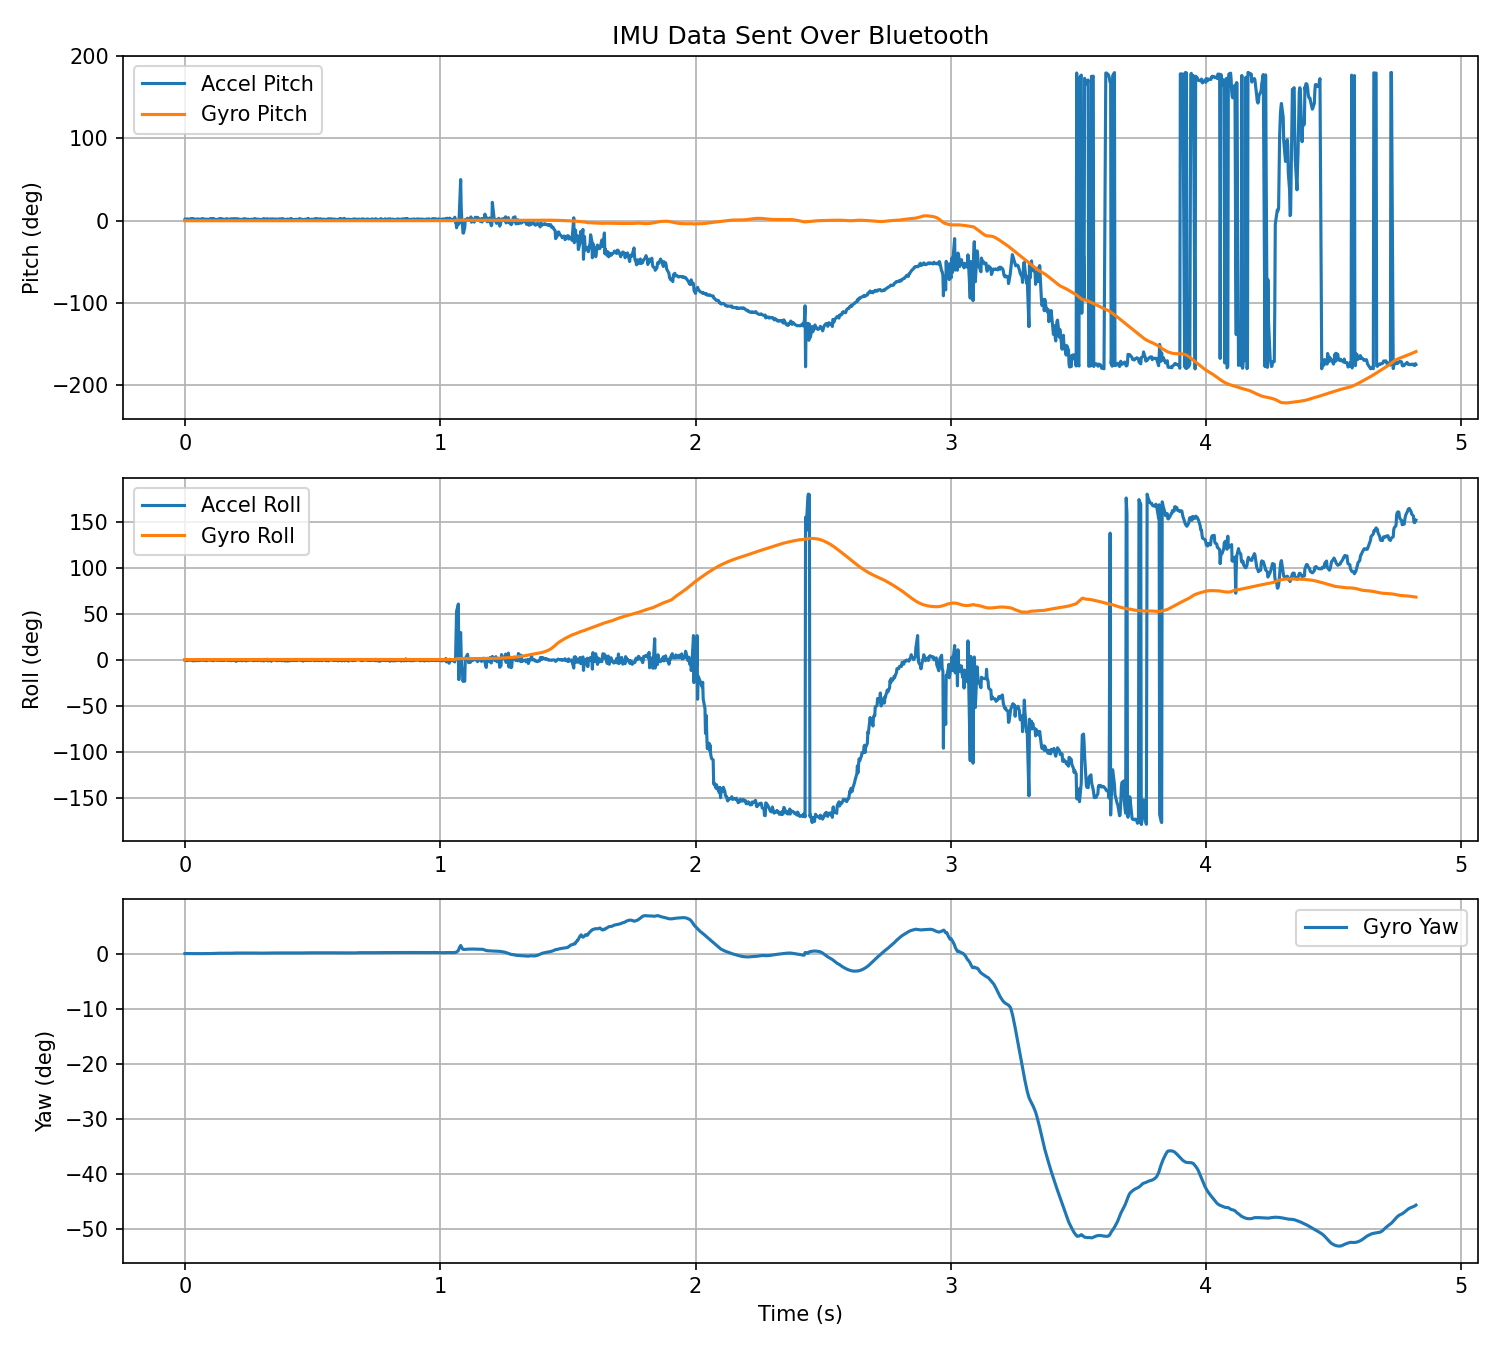
To optimize the speed of the data collection, i removed all the delay() callsand the print statements. I also stored data in a list only when new sampels were available, I made the code return and save one sample per run. i was abel to Achieve a sampling rate of ~311Hz (10x faster than initial 30Hz). For each meaasurment (e.g. pitch_a, roll)a, pitch_g, etc.) I stores them in an array; made it easier for me to index. I used floats which were 4 bytes, it helps hoenslty was just helpful to save memory. Calculating, each sample used 24 bytes, knowing we had 384 KB RAM , the artimus can store about 16,000 samples (384,000 / 24). Given the sampling rate of 311Hz, the artimus can record data for approximately 52 seconds before running out of memory.
8. Record a Stunt
Open video if it doesn’t play above.